
The Delinquency Chart Measures Lenders, Not Households
One statistic has carried the case that the American consumer is breaking. Between the third quarter of 2022 and the first quarter of 2026, the share of credit card balances 90 or more days past due climbed from 7.6% to 12.8%, prompting concern that Americans were falling behind on their debts at rates not seen since the Great Recession. On August 11 the Federal Reserve Bank of New York published the reconciliation of that number, and the answer sits with how lenders report old debt rather than with how households are paying their bills.
What a Delinquency Rate Actually Counts
A delinquency rate looks like a fact about borrowers. It is a ratio, and what it says depends entirely on what its author puts above and below the line.
Three are in circulation, and the argument about the American consumer has been conducted by mixing them. The first is the stock delinquency rate published in the New York Fed's Quarterly Report on Household Debt and Credit, built from the New York Fed Consumer Credit Panel. It measures the share of balances actively reported on credit reports that are 90 or more days past due, reading the situation from the borrower's file. The second is the flow rate, published in the same report, which divides the balances that newly became 90 or more days past due in a quarter by the balances that were current or less than 90 days late the quarter before, annualized as a four quarter moving sum. It counts new entries into trouble. The third comes from the Board of Governors, aggregated from bank Call Reports, and measures the share of balances still on lenders' books that are 30 or more days past due.
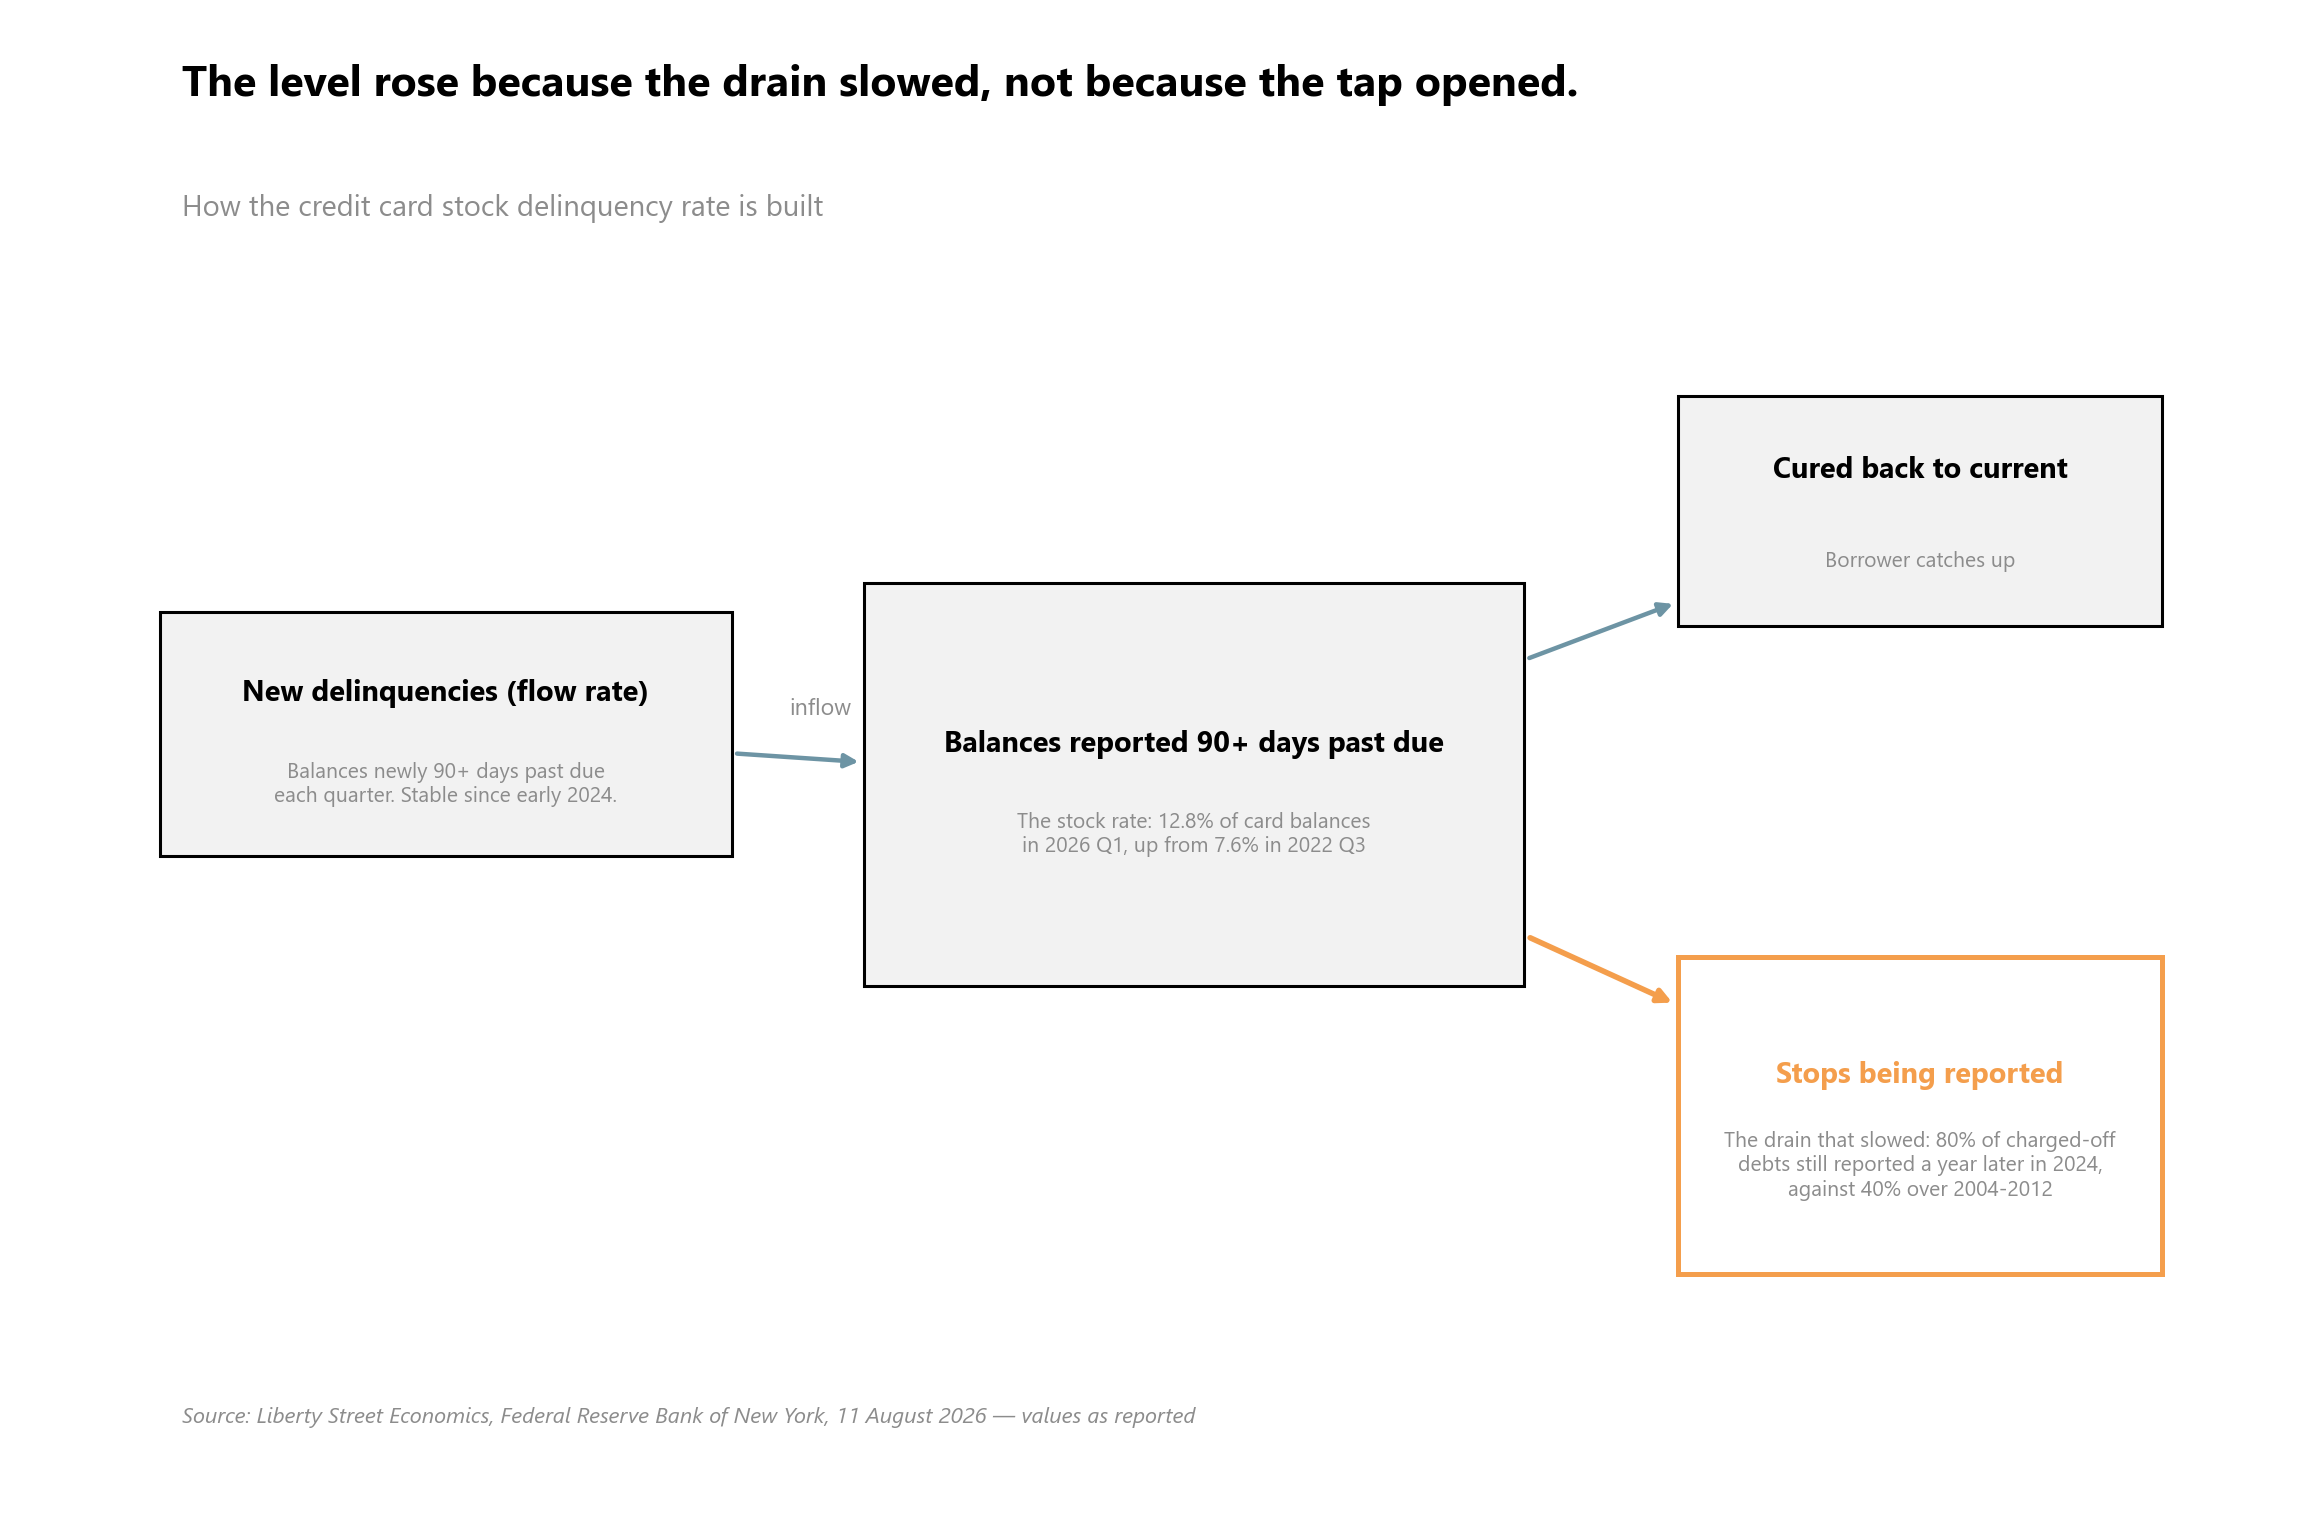
At first glance the arithmetic looks wrong. The New York Fed's stock rate, which starts counting at 90 days, sits consistently above the Board's rate, which starts counting at 30. The reason is what happens to a loan that goes badly enough. Somewhere between 120 and 180 days past due, a lender charges the loan off, meaning the balance leaves its balance sheet and exits both the numerator and the denominator of the Board's series. The charge-off registers once, in the period it occurs, and then it is gone from the lender's books.
The borrower, however, still owes the money. Lenders may keep pursuing the debt and updating the credit bureaus, so the balance stays on the credit report. The New York Fed keeps those balances in its stock rate for exactly that reason, because they remain part of what the household owes.
The Gap Is Stale Debt, Not New Distress
Once the three series are defined, the divergence has a mechanical explanation. The stock rate moves on three things: how fast new debts go bad, how fast existing bad debts cure, and how long old charged-off debts stay in the data. Only the first is what most readers think they are looking at.
Through the post-pandemic period, new delinquencies accelerated and stock and flow rose together. Then the pace of new delinquencies stabilized in early 2024, and the two series separated. The stock rate kept climbing on accumulating charged-off balances. When the authors, Donghoon Lee, Daniel Mangrum, Joelle Scally, Tejas Sinha and Wilbert van der Klaauw, break the stock rate into its buckets, the recent rise comes almost entirely from balances classed as severely derogatory, the category that corresponds largely to accounts lenders have marked as charged off.
That pool is growing because lenders are reporting these debts for longer than they used to. Between 2004 and 2012, roughly 40% of borrowers' charged-off debts were still being reported to the credit bureaus one year later. By 2024 that figure had doubled to 80%.
Two explanations fit. Either lenders are having less success collecting, leaving more debt outstanding, or their reporting practices have changed for reasons unrelated to how the debt is performing. The authors rule out the first: recovery rates reported by the Consumer Financial Protection Bureau have only changed slightly, which makes collection difficulty an unlikely driver. That leaves a change in reporting behavior uncorrelated with how the debt is performing, which carries no information about household finances.
The test they run settles it. Strip the severely derogatory balances out of both the numerator and the denominator of the stock rate, and it falls back into line with the flow rate and with the Board's Call Report series. The three measures that appeared to tell different stories tell the same one.
None of this says households are comfortable. The New York Fed's conclusion is precise and worth quoting as written: by the flow measures, "the pace of credit card delinquency is elevated but has been largely stable since 2024." Elevated and stable, not low. The stock rate also remains the right tool for a different question, namely how much debt is owed and how much of it is delinquent, and it matters directly to the more than 23 million Americans still carrying charged-off card balances on their credit reports. The quarter itself was quiet: total household debt fell by $13 billion in the second quarter of 2026, and delinquency rates across most products stayed fairly stable.
The Other Dashboard Is Deteriorating
Three days after the New York Fed post, the Commerce Department reported that retail sales fell 0.6% in July. It was the first decline in nine months and the largest in 14, against a Reuters consensus of a 0.1% increase. Sales were still up 5.0% from a year earlier. Because consumer prices rose only 0.1% over the month, economists read the decline as a fall in volume rather than a price effect.
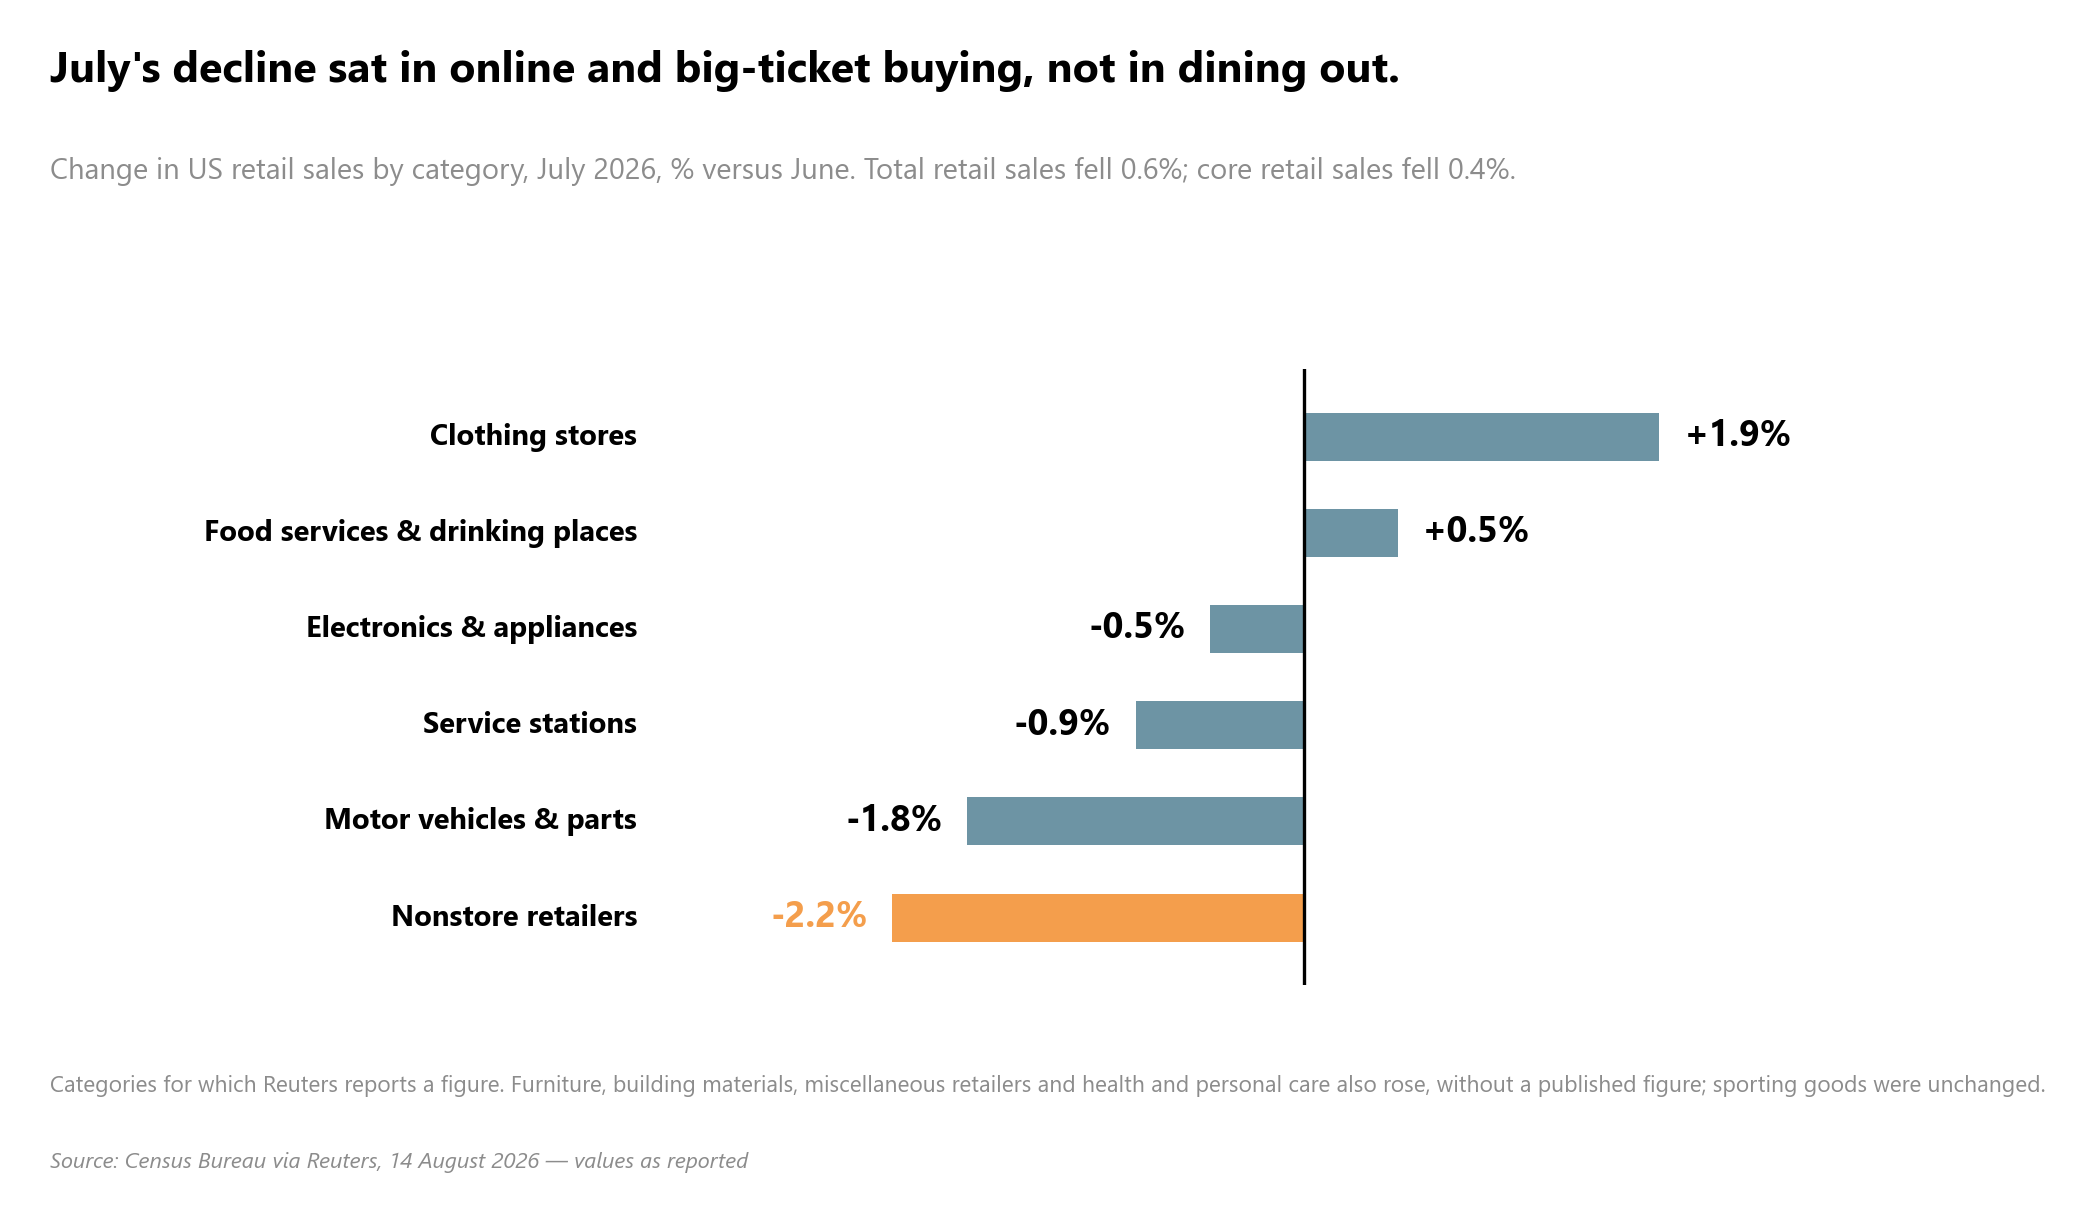
The composition is where it gets uncomfortable. Receipts fell 2.2% at nonstore retailers, 1.8% at motor vehicle and parts dealers, 0.9% at service stations and 0.5% at electronics and appliance stores. Clothing stores rebounded 1.9% on back to school buying, and food services, the only services component in the report, rose 0.5%. Core retail sales, which exclude autos, gasoline, building materials and food services and track the consumer spending component of GDP most closely, fell 0.4% where economists had expected a 0.3% gain.
The mood series moved the same way. The University of Michigan's Consumer Sentiment Index dropped to 51.0 from 55.2, ending two straight months of improvement, with sentiment deteriorating across the political spectrum. "Unhappy consumers buy less than happy consumers," said Carl Weinberg, chief economist at High Frequency Economics. "Consumers are quite unhappy by historical standards." Gasoline is a large part of why. Prices at the pump are hovering just above $4 a gallon, down from about $4.39 early in the US-Israeli war with Iran, but far above the $2.98 average before that conflict began in February. Goldman Sachs cut its third quarter GDP growth forecast by half a point to 2.2%, and some economists now see consumer spending growth slowing below a 2% annualized rate from 3.2% in the second quarter.
Fixed household costs are pointing the same direction. Insurify's midyear report projects auto insurance premiums rising in 32 states by the end of 2026, after increases in 27 states during the first half, reversing a 6% average national decline last year. Repairs have become expensive: auto maintenance and repair costs are up 45% over five years, according to Insurify and Bureau of Labor Statistics data, as cameras, sensors and driver assistance systems turn minor collisions into major claims.
Which Series Answers Which Question
Both dashboards are accurate. They are answering different questions, and the lag between them is the whole story.
Credit files record how households are servicing debt they took on months or years ago, and they hold that record for a long time, now longer than they used to. Retail sales and sentiment record a decision taken this month. A household that is current on its cards and buying less is invisible in the first series and obvious in the second. Reuters flagged two mechanical reasons July looked weak, exhausted tax refunds and Amazon pulling Prime Day forward to June, which is why Menzie Chinn's chart at Econbrowser plots retail sales alongside payrolls, manufacturing production and personal income rather than on its own.
The same week supplied two more reminders that the question shapes the answer. The New York Fed's own July Survey of Consumer Expectations, released August 7, found short term inflation expectations ticking down and household finance expectations improving, while the Michigan index fell to 51.0. Two surveys, two questions, two directions.
Lettuce made the point in the price data. Lettuce prices fell 16.4% from June, the largest one month decline on record and the sharpest monthly deflation in the consumer price index food category, yet they remain about 7.5% higher than a year ago, more than double the pace of the overall CPI basket. That drop was not relief in grocery budgets. It was a multistate cyclospora outbreak that made shoppers avoid the product, as economist Jeremy Horpedahl of the University of Central Arkansas described it. Chipotle put the hit at roughly 2 percentage points of sales in the second half of July, and dollar sales of prepackaged salads fell 14% in the four weeks ending July 25 against the year-ago period, according to NielsenIQ. A falling price index registered a food safety scare.
Who is still spending completes the picture. Economists at PNC Financial found in bank data "increasing evidence of upper-income and older households cashing in on wealth gains to support spending," with the S&P 500 up 14% so far this year.
What It Means
The practical rule is narrow and useful. Do not cite the stock delinquency rate to answer how households are doing, and do not cite the flow rate to answer how much is owed. The chart that traveled furthest this summer was a correct answer to a question nobody was asking.
The reporting shift deserves attention on its own terms. A charged-off balance that had a 40% chance of still being on file a year later now has an 80% chance, which lengthens the credit shadow cast by a single bad year for anyone applying for a loan. That is a change in the machinery of credit reporting, not a change in borrower behavior, and it will keep pushing the stock rate up for as long as it continues.
Meanwhile the genuine deterioration in this period is sitting in plain view somewhere else, in a volume decline in spending, a sentiment reading of 51.0, gasoline above $4 and insurance renewals rising in 32 states. The series worth watching next quarter are the flow rate on pages 13 and 14 of the New York Fed's Quarterly Report, and core retail sales. Neither is the chart that went around.


Comments