
Stagflation-Lite: Weak Jobs, Energy Shocks, and Yield Curves
The unexpected U.S. payroll drop in July combined with soaring diesel prices has reignited fears of stagflation across financial markets. Yet beneath headline inflation concerns lies a deeper structural weakness driven by labor force dropouts, consumer demand destruction, and shifting forward curves. Understanding these dynamics reveals why central banks risk misinterpreting supply-side cost pressures as genuine economic expansion.
Demand destruction versus inflation in a cost-push environment
Financial discussions frequently conflate supply-side cost increases with genuine monetary inflation. When energy prices surge due to geopolitical conflict or refinery shutdowns, the cost of moving goods through supply chains increases rapidly. Recent fuel market disruptions highlight this dynamic clearly. California diesel prices climbed to 6.92 dollars per gallon, significantly above the national average of 5.36 dollars per gallon, following ongoing military conflict in the Middle East and attacks on international refining capacity. According to analysis from Lipow Oil Associates, the global petroleum market is currently short roughly 8% of total diesel demand.
This distinction between cost-push energy shocks and demand-driven inflation is essential from first principles. Higher fuel expenses operate as a direct tax on both enterprise margins and household budgets. Nearly one-third of total U.S. containership imports and exports move through the San Pedro Bay port complex in California. Analysts from JPMorgan noted that when West Coast fuel costs rise, those transportation expenses filter directly into freight rates and delivered product costs across the entire country.
When input costs escalate while consumer purchasing power remains flat or declining, price increases do not reflect an overheating economy. Instead, as Eurodollar University researcher Michael Snider observes in his core monetary framework, genuine monetary inflation requires sustained expansion in currency and credit alongside robust end-user demand. Elevated input costs in a fragile purchasing environment act to destroy demand rather than create self-sustaining price spirals. Consumers facing higher essential transportation and heating costs are forced to reduce spending elsewhere, converting supply-side energy shocks into broader economic deceleration.
The corporate ceiling and retail price resistance
Following initial post-pandemic supply chain bottlenecks, major corporations engaged in broad price increases. Firms raised retail tags well above immediate input cost escalations, utilizing public inflation headlines as narrative cover to expand corporate profit margins. This phenomenon, often referred to as excuseflation, functioned effectively while households held lingering stimulus savings and accessed consumer credit. However, recent quarterly data indicates that corporate pricing power has encountered an unyielding structural ceiling.
Retail evidence across major consumer sector firms confirms that buyers are actively resisting further price increases. Major retail operator Walmart implemented aggressive price cuts and introduced digital shelf tags across its store network to enable rapid price adjustments and maintain traffic volumes. Consumer goods producers have hit similar limits. When PepsiCo continued pushing price increases on its snack lines, sales volumes turned negative for the first time in over a decade. The volume decline forced executive management to shift strategic priority back toward product affordability to protect market share.
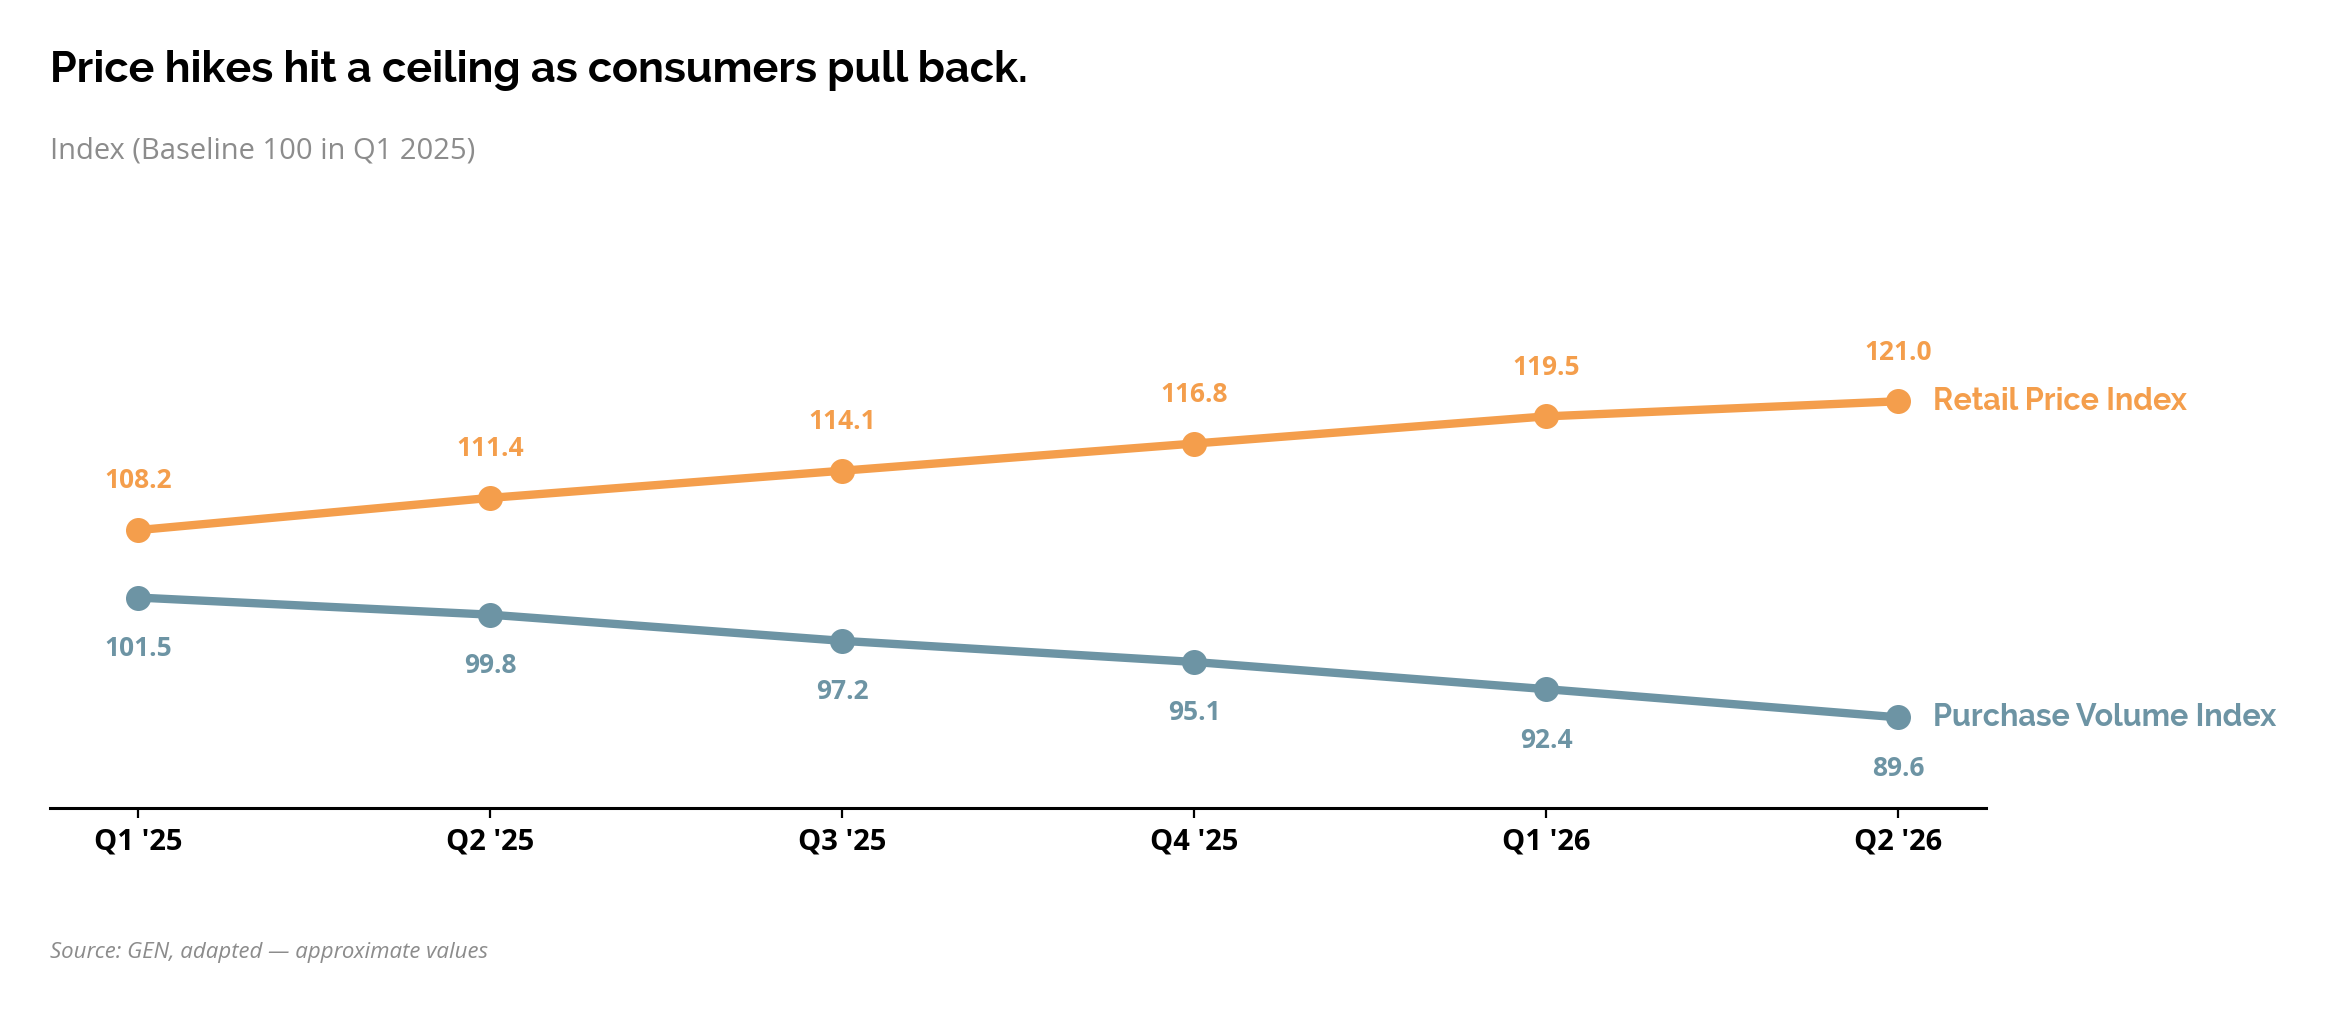
| Period | Retail Price Index (Baseline 100) | Consumer Purchase Volume Index |
| --- | --- | --- |
| Q1 2025 | 108.2 | 101.5 |
| Q2 2025 | 111.4 | 99.8 |
| Q3 2025 | 114.1 | 97.2 |
| Q4 2025 | 116.8 | 95.1 |
| Q1 2026 | 119.5 | 92.4 |
| Q2 2026 | 121.0 | 89.6 |
Source: GEN, adapted — approximate values
As final demand softens, corporations can no longer pass through elevated transport and raw material costs without sacrificing sales volume. The inability to pass on costs forces margin compression across retail and wholesale supply chains. When input costs rise due to energy shocks while consumer purchase volumes contract, corporate earnings face severe pressure, signaling an end to arbitrary pricing power.
Behind the U.S. employment contraction and labor dropouts
The labor market snapshot for July 2026 provided clear evidence of underlying economic deceleration. Nonfarm payrolls contracted unexpectedly by 23,000 jobs, contrasting sharply with consensus projections from Dow Jones that anticipated an addition of 83,000 jobs. Furthermore, previous monthly figures underwent steep downward revisions. June payroll figures were revised down to a modest gain of 20,000 jobs, while May numbers were revised downward by 66,000 to stand at 63,000. Over the preceding twelve months, average monthly job growth collapsed to just 34,000.
Job losses were concentrated in key service and public sectors. Local government education shed 50,000 positions, leisure and hospitality lost 40,000 jobs, retail trade fell by 19,000, and financial activities contracted by 14,000 positions. Healthcare added 22,000 jobs, remaining well below its 12-month average gain of 36,000, while construction added 22,000 jobs. Private sector payrolls managed a meager increase of 30,000 jobs as overall government employment dropped by 53,000. Household survey employment, which calculates the total number of employed individuals, fell by 87,000.
The official unemployment rate appeared to improve, slipping from 4.2% to 4.1%. However, this decline occurred for troubling structural reasons. The civilian labor force shrank by 264,000 workers in July as discouraged job seekers stopped searching for employment. This pushed the labor force participation rate down to 61.4%, marking its lowest non-pandemic level since 1976. The employment-to-population ratio dropped to 58.9%, its lowest reading since May 2014. Meanwhile, average hourly earnings rose by only 2 cents during the month, pulling annual wage growth down to 3.2%, the lowest rate recorded since May 2021.
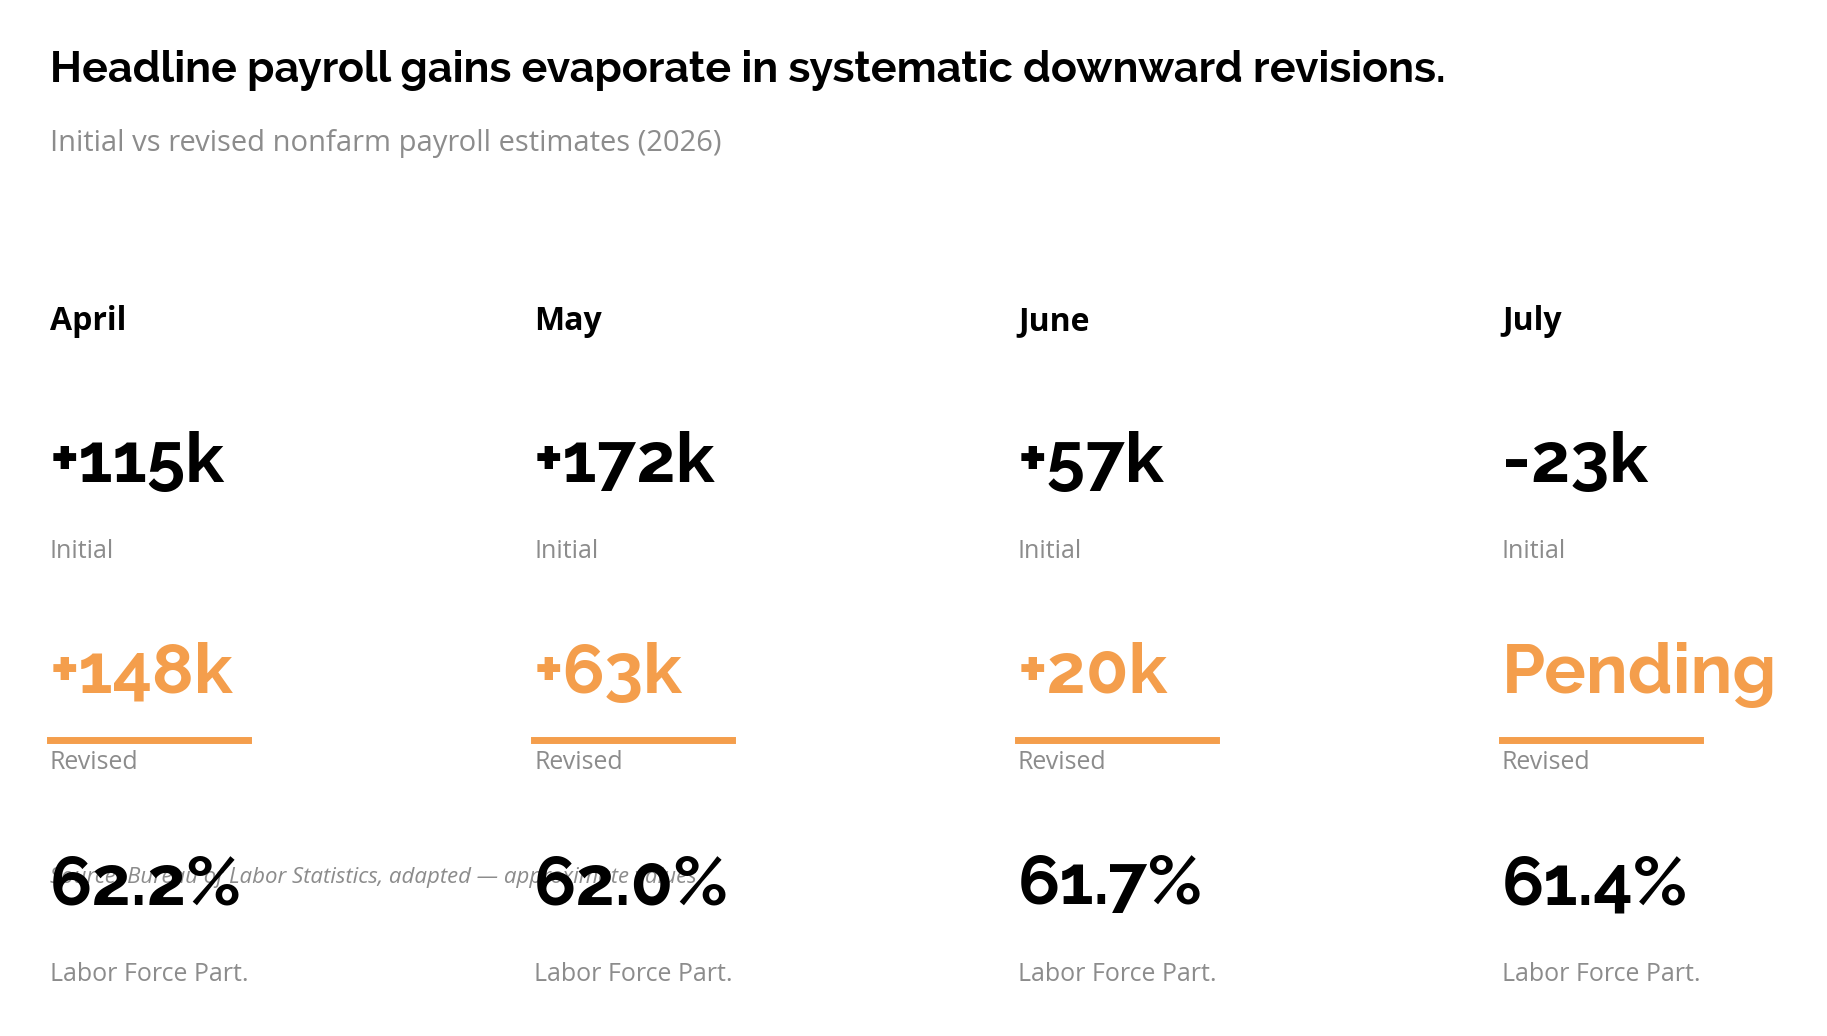
| Month | Initial Headline Payrolls | Revised Payrolls | Labor Force Participation Rate (%) |
| --- | --- | --- | --- |
| April 2026 | +115,000 | +148,000 | 62.2% |
| May 2026 | +172,000 | +63,000 | 62.0% |
| June 2026 | +57,000 | +20,000 | 61.7% |
| July 2026 | -23,000 | Pending | 61.4% |
Source: Bureau of Labor Statistics, adapted — approximate values
This sequence follows a recognizable mini-cycle pattern identified in labor market research. Headline nonfarm payroll estimates initially overstate employment strength due to seasonal adjustments and statistical modeling. Subsequent downward revisions systematically erase those reported gains, bringing official figures into alignment with weak secondary indicators such as the Job Openings and Labor Turnover Survey. When labor force participation collapses alongside declining private sector earnings growth, headline stability masks a low-hire environment and weakening consumer income.
Looking beyond the classic yield curve
Financial media coverage has focused heavily on benchmark U.S. Treasury yields, where the nominal 30-year yield recently rose above 5%, reaching levels not sustained since 2007. Conventional market commentary often interprets elevated long-term yields as a reflection of strong future growth or persistent inflation expectations. However, analyzing the underlying mechanics of sovereign debt supply reveals a very different driver.
Elevated nominal long-term yields are primarily driven by massive government net debt issuance and central bank policy risk. According to official announcements from the U.S. Department of the Treasury, the federal government plans to borrow 739 billion dollars in net privately-held marketable debt during the third quarter of 2026 alone. This estimate exceeded previous projections by 68 billion dollars due to lower-than-expected tax cash flows. Treasury forecasts an additional 628 billion dollars in net borrowing for the fourth quarter, pushing total national debt toward 41 trillion dollars. Total net interest payments reached 827 billion dollars through June of fiscal year 2026, surpassing national defense and Medicare expenditures. With approximately 33% of national debt maturing within twelve months, refinancing at higher average rates forces government borrowing costs rapidly upward regardless of underlying growth.
Examining derivative forward curves beyond nominal benchmark yields demonstrates that markets are pricing monetary policy error rather than durable economic growth. Fixed income derivative structures, including SOFR and Eurodollar futures curves, display pronounced inversions. Swap spreads remain historically tight, while TIPS break-even inflation rates remain flat within long-term disinflationary bounds. These derivative market signals confirm that institutional investors are pricing central bank over-tightening and eventual interest rate cuts to offset economic contraction, mirroring curve behavior observed prior to previous downturns in 2008 and 2018.
What it means
Central banks face a critical analytical error. Policy officials at the Federal Reserve risk mistaking supply-driven price spikes in fuel and logistics for genuine demand inflation. If monetary authorities maintain restrictive policy rates or contemplate further tightening to combat energy-driven cost pressures, they will drive interest rate policy directly into an accelerating labor market downturn. Falling labor force participation and declining real private income demonstrate that end-user demand is fragile, meaning further policy tightening would amplify demand destruction.
For investors and corporate executives, three key indicators require systematic tracking. First, monitor corporate profit margin compression across retail and consumer staples, as businesses absorb rising freight costs while hitting retail price resistance. Second, track forward interest rate futures curves, specifically SOFR spread inversions, for institutional pricing of central bank policy pivots. Third, observe sovereign debt refinancing schedules, as expanding government interest burdens absorb available capital without generating underlying productivity gains.


Comments